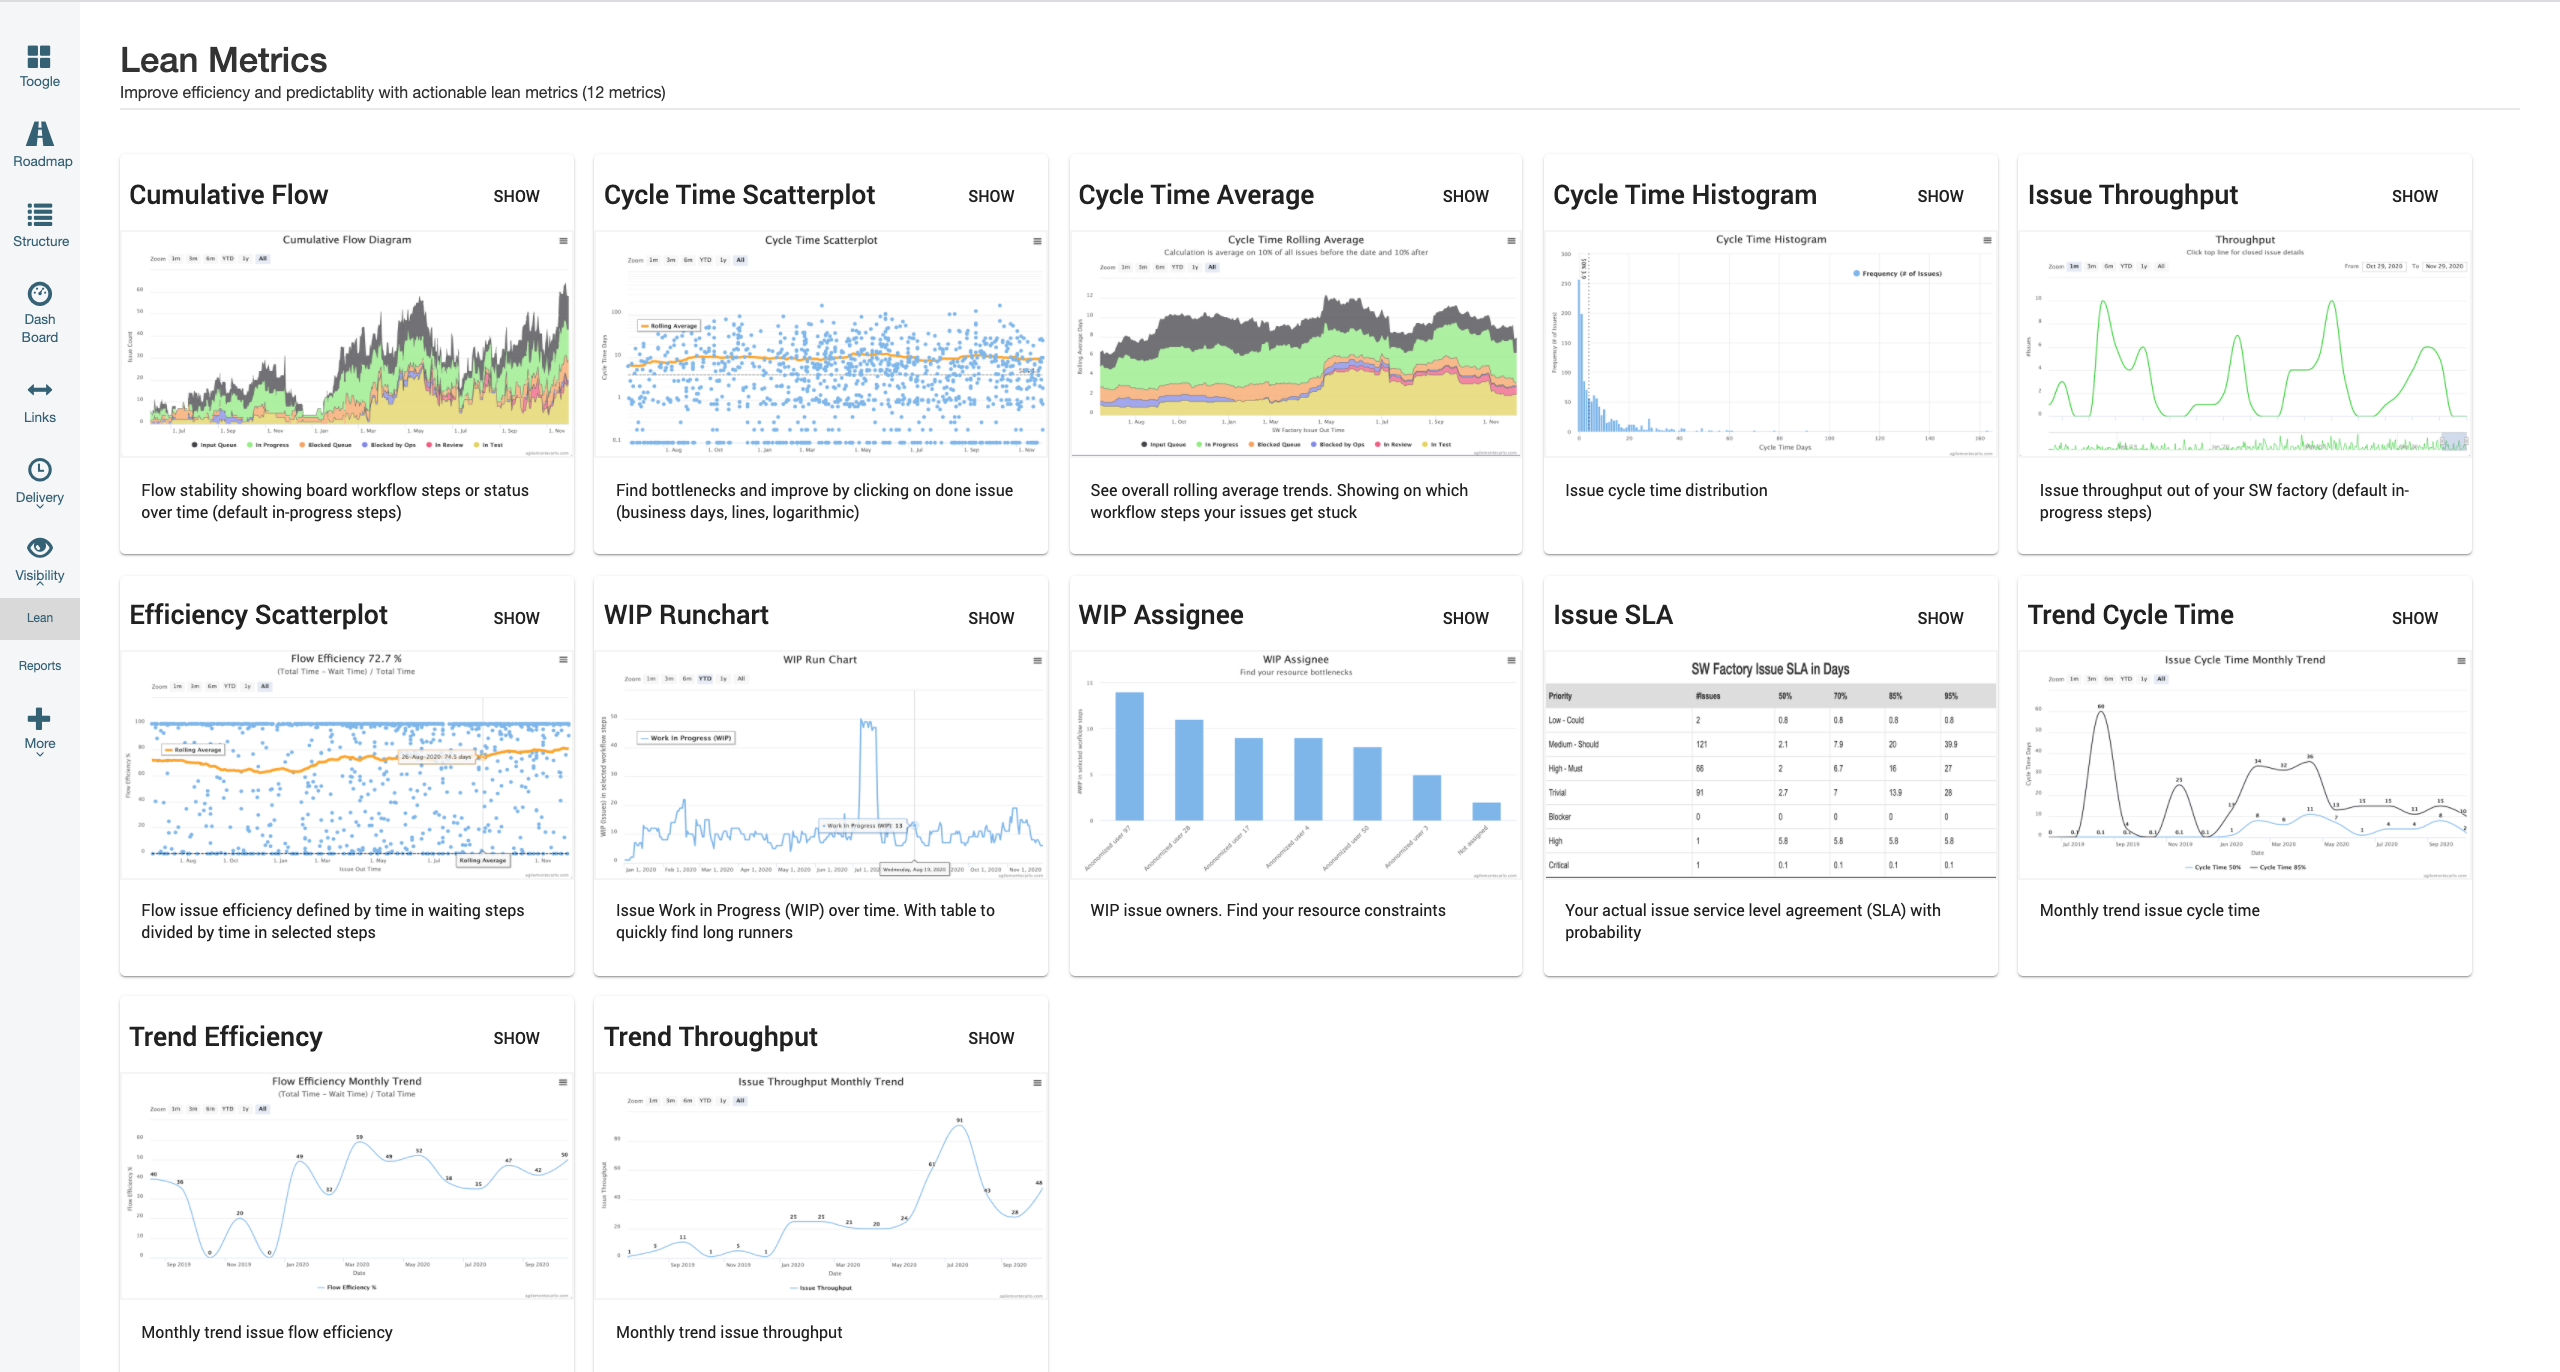
The solution offers 12 actionable lean metrics. All configurable and clickable to the underlaying Jira Issues.
It is recommended to use the global filter to slice and dice the data for your lean metric needs.
There are a large number of articles on Internet on how to work with lean metrics, improve flow, efficiency and predictability. The intention with this help documentation is not to repeat that information. Please see a good tutorial and some basic information below.
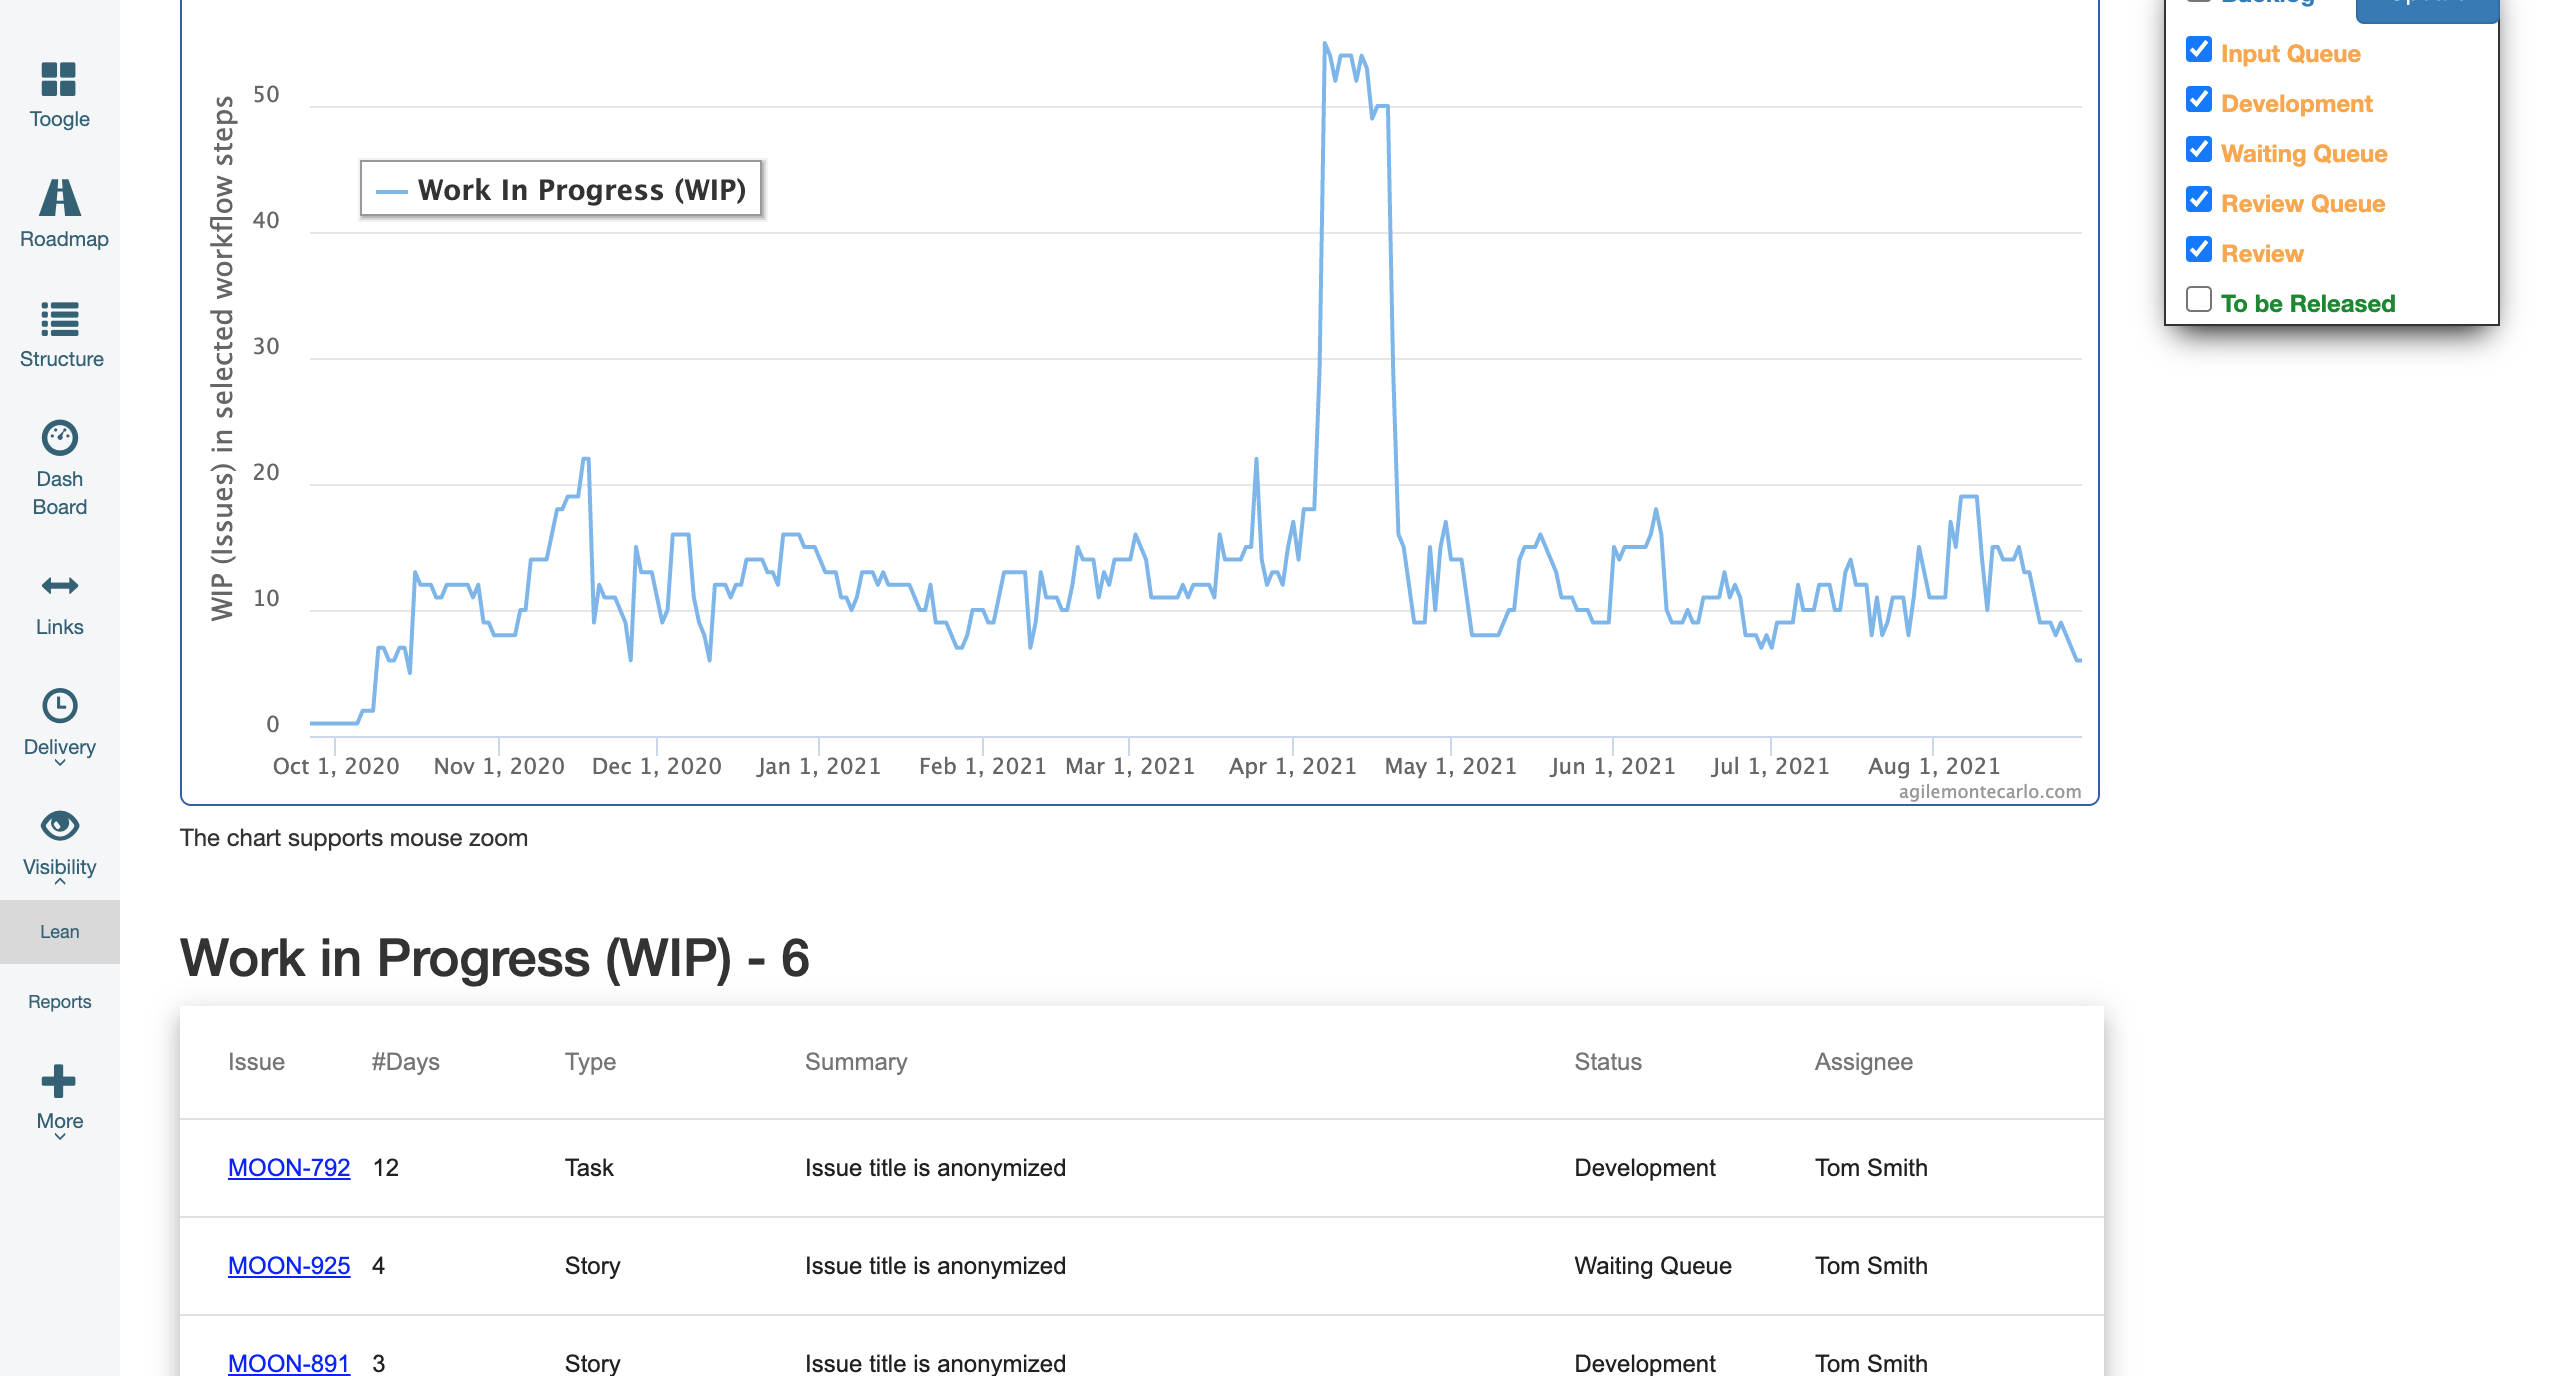
WIP Run Chart - Identify Long Runner Issues
Basic Configuration
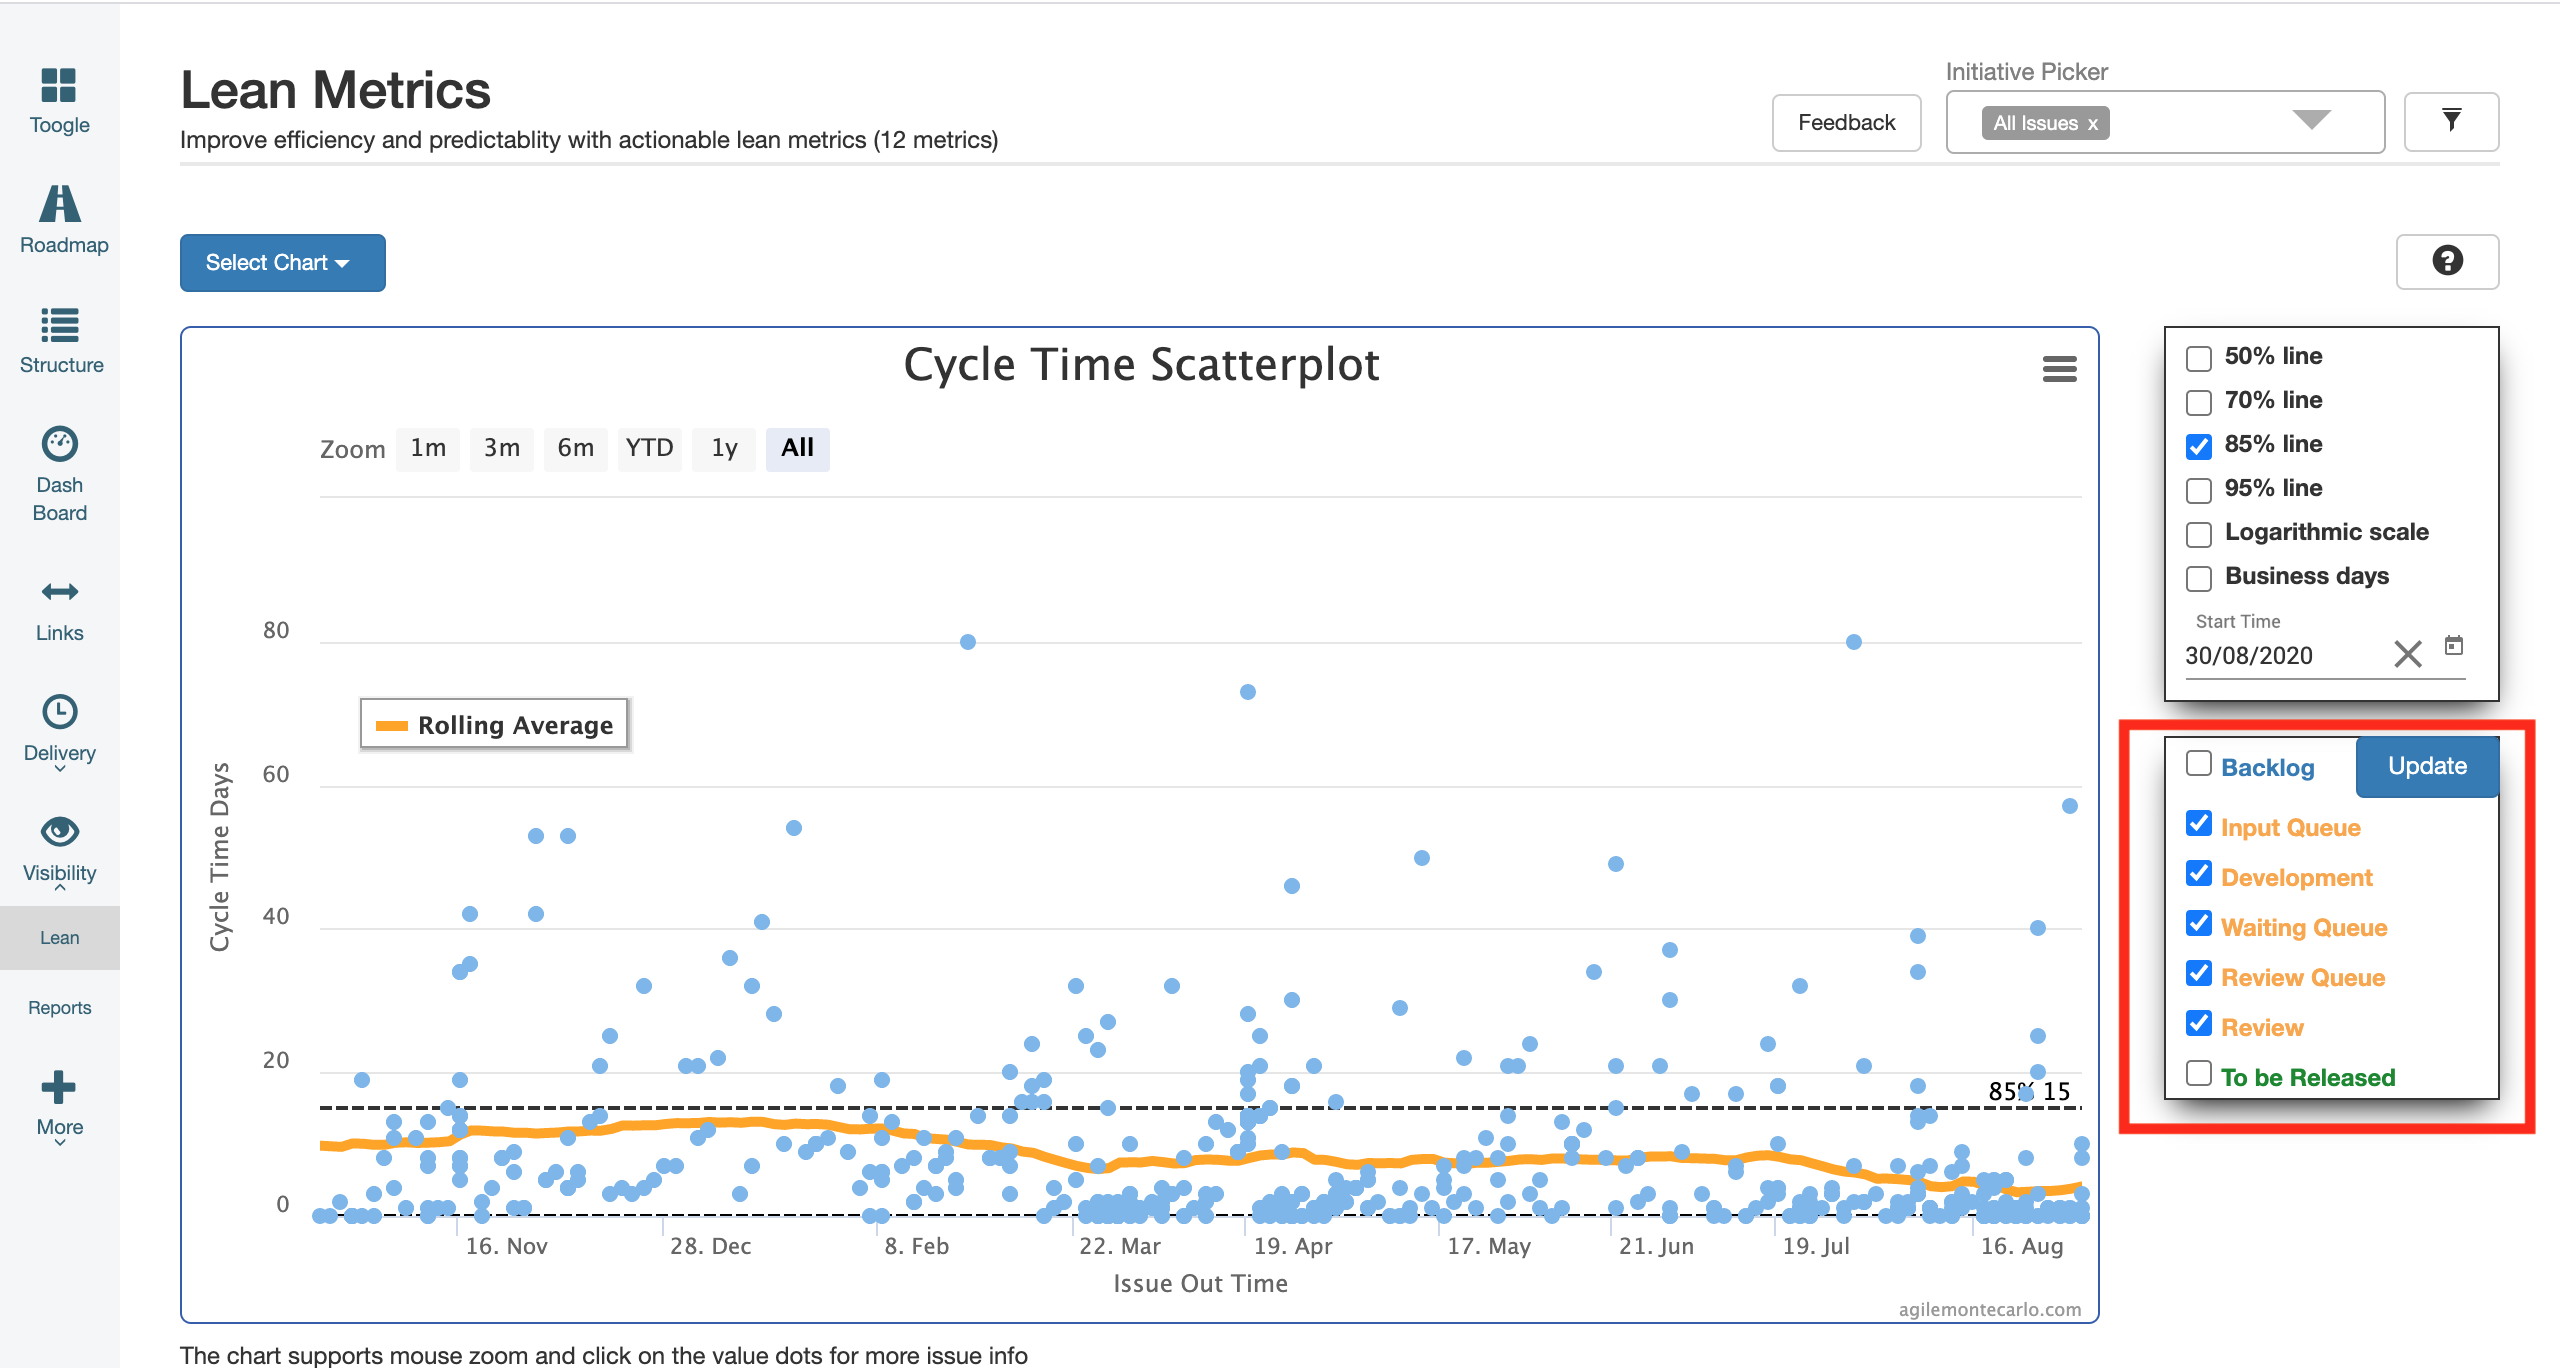
The key configuration, that is the same for all lean charts, is the “SW factory“ highlighted with red below. All Jira issue statues or board columns that are marked are considered within the SW factory. All unmarked are considered as outside.
Below “Cycle Time Scatterplot“ chart as an example: Each dot is an issue that has entered the SW factory and then left it. The time between entering and leaving is the issue cycle time and is marked with a blue dot. Clicking on the dots will open a detailed issue view with information on which statuses the issue did spend time on in the SW factory. This is a key information driving flow improvements, finding your bottlenecks and in the end improving efficiency and predictability.
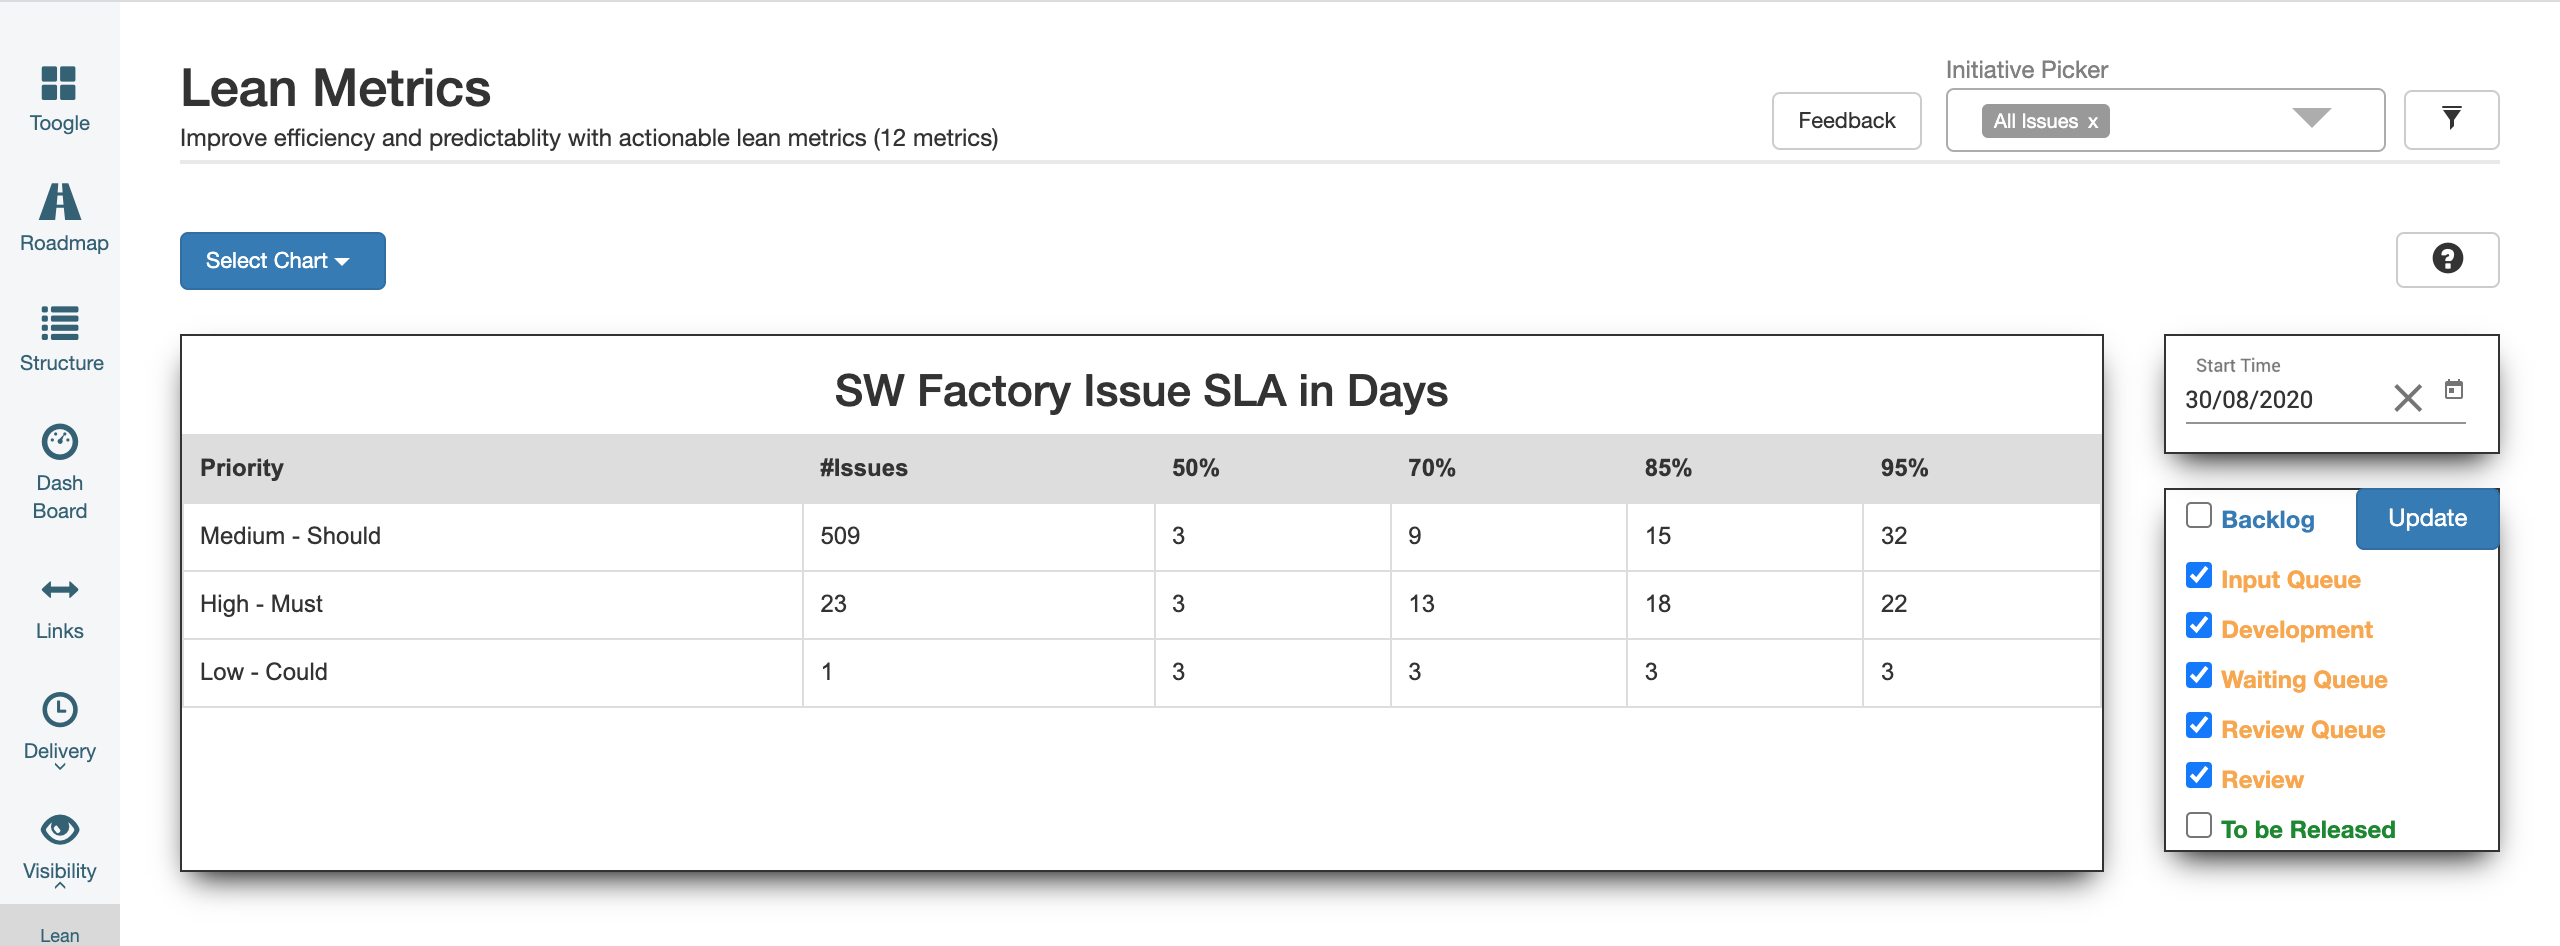
Service Level Agreement (SLA)
The SLA chart shows the actual service level agreement lead time per issue priority. Adding the global filter enables you to show your actual SLA to stakeholders on any issues, components, project…
WIP Run Chart - Identify Long Runner Issues
Select the WIP Run Chart (Work In Progress). Then scroll down to show a table with all the long runners and who they are assigned to.