The solution offers 12 reports. All configurable and clickable to the underlaying Jira Issues. The reports are hopefully self-explaining and see below only some basic information.
It is recommended to use the global filter to slice and dice the data for your reporting needs.
Bug Density

Bug Density
For most software teams bad quality is the biggest waste and very often a root cause for delays. The problem statement is then how do you know if a team or project have bad quality? A good report for that is bug density. It measures bugs divided with issue output (issue count or story point). So a bug density of 50% means that for 10 issues/story point delivered there is 5 new bug created.
Different team have different bug density depending on a number of factors. Below team is averaging at 22%.
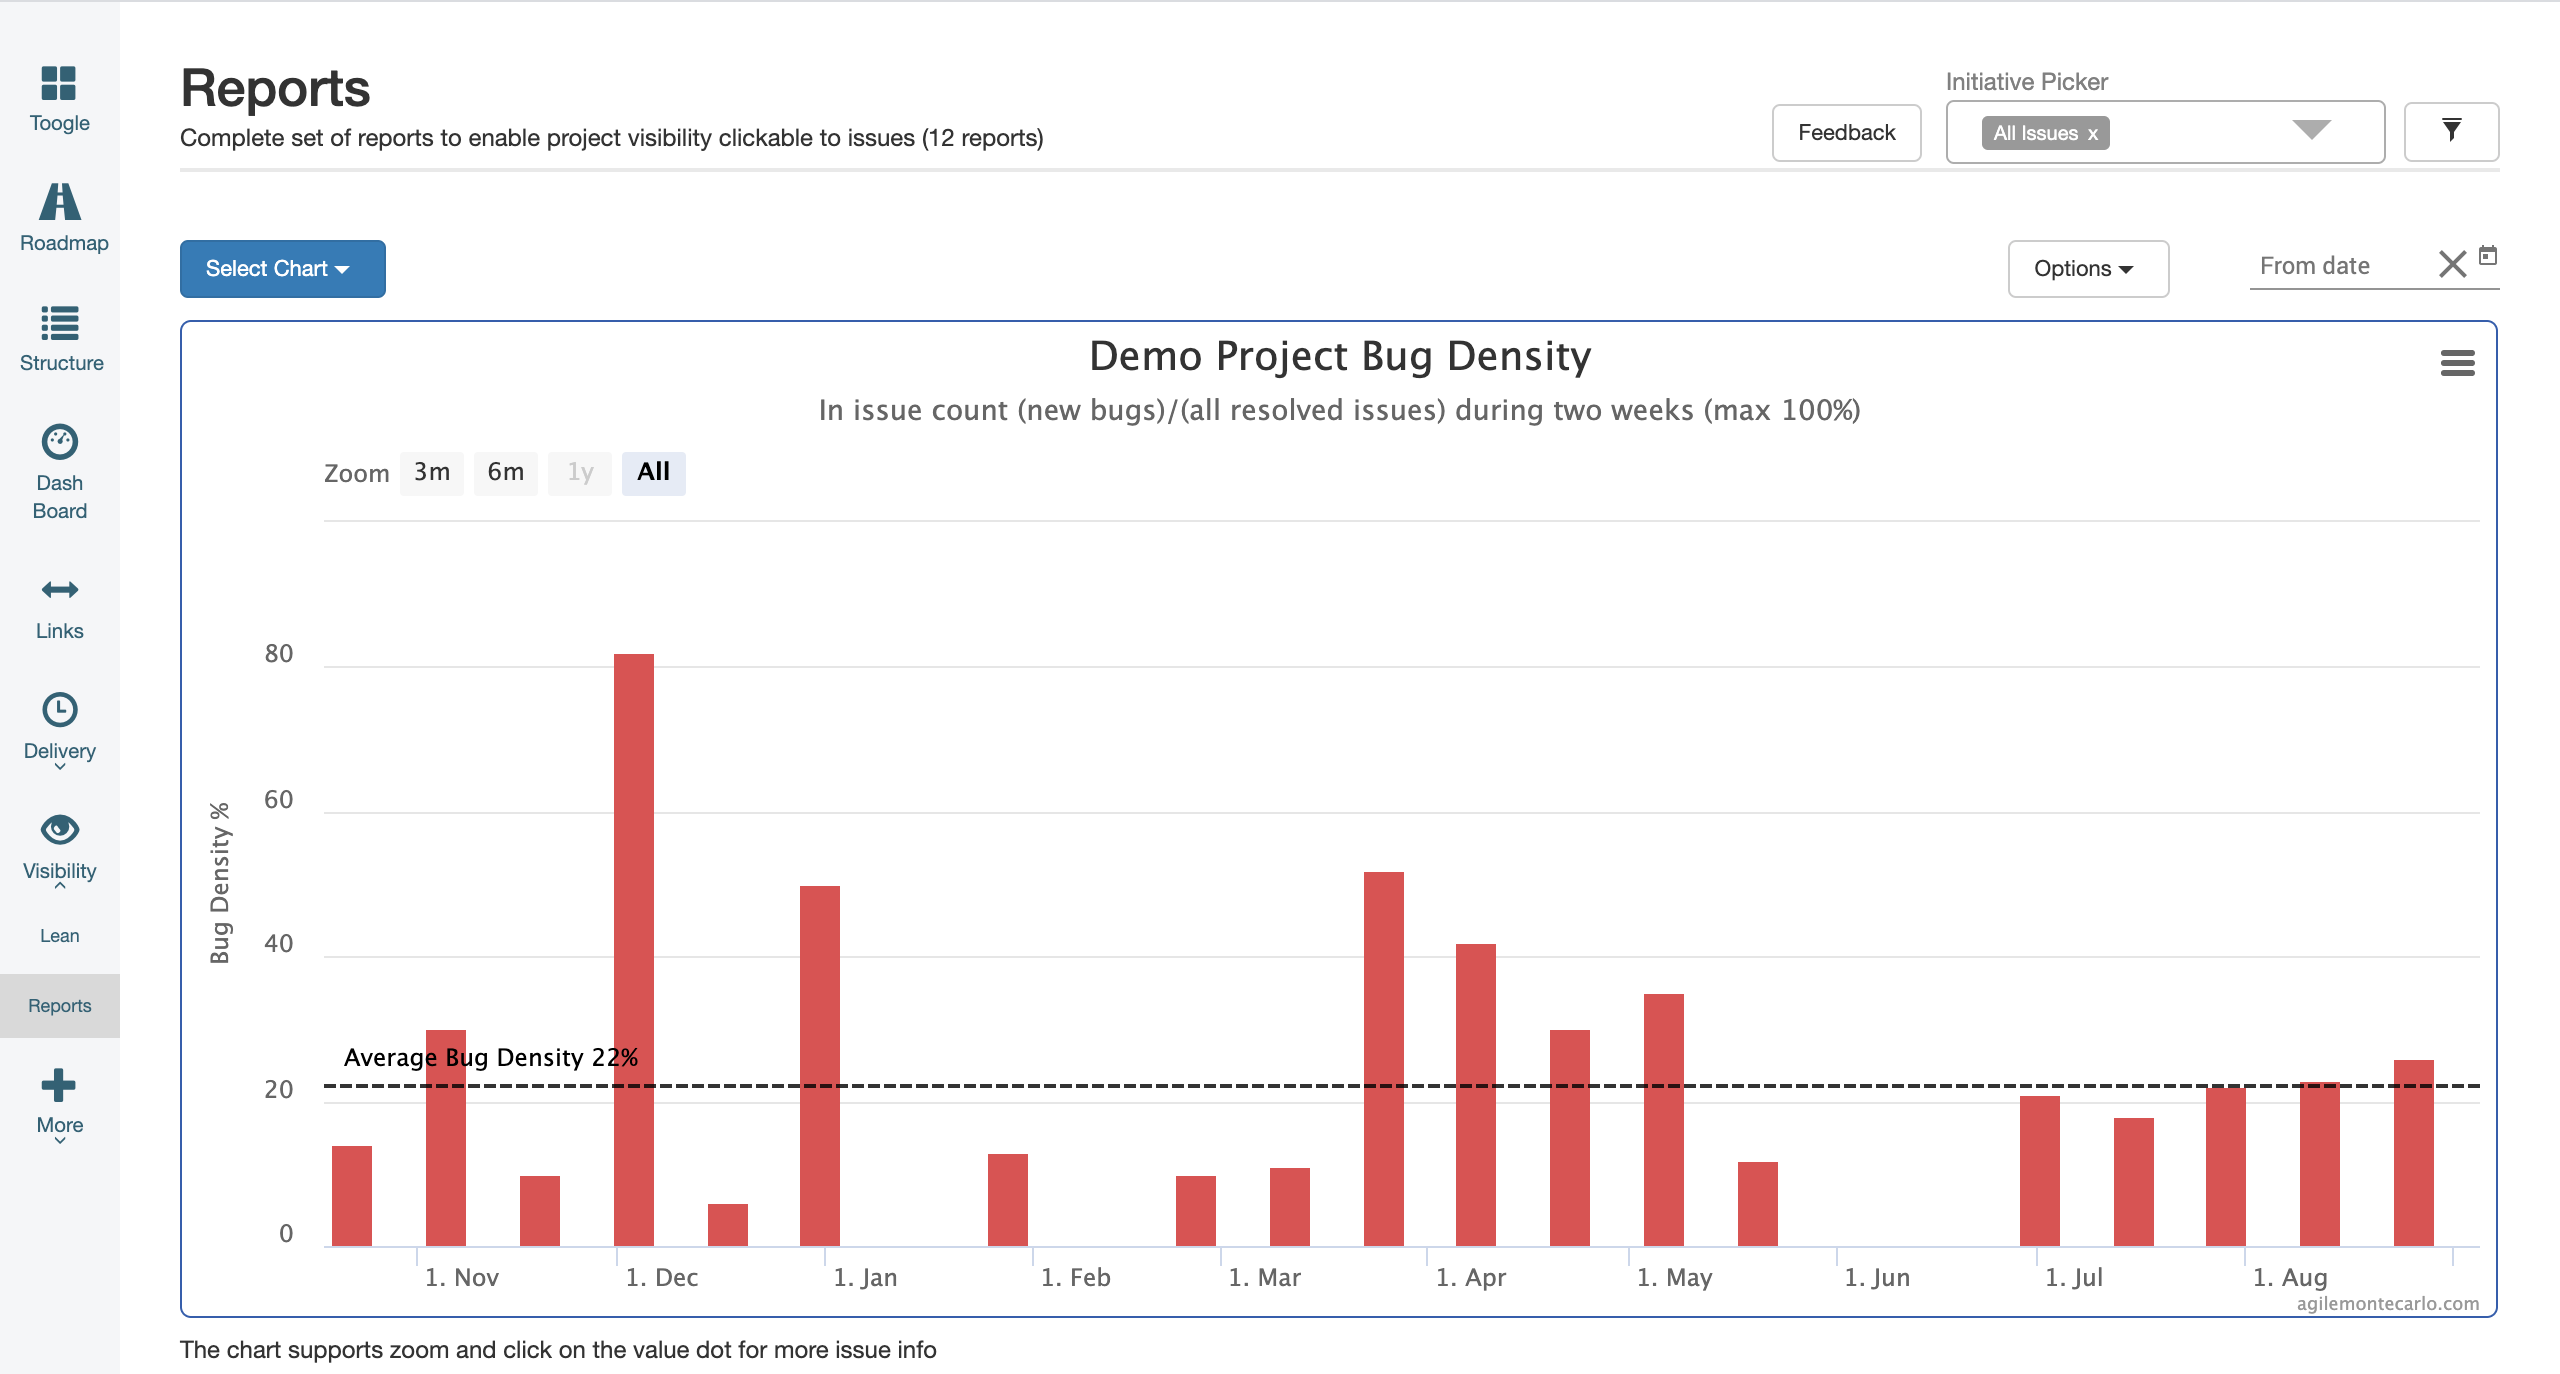
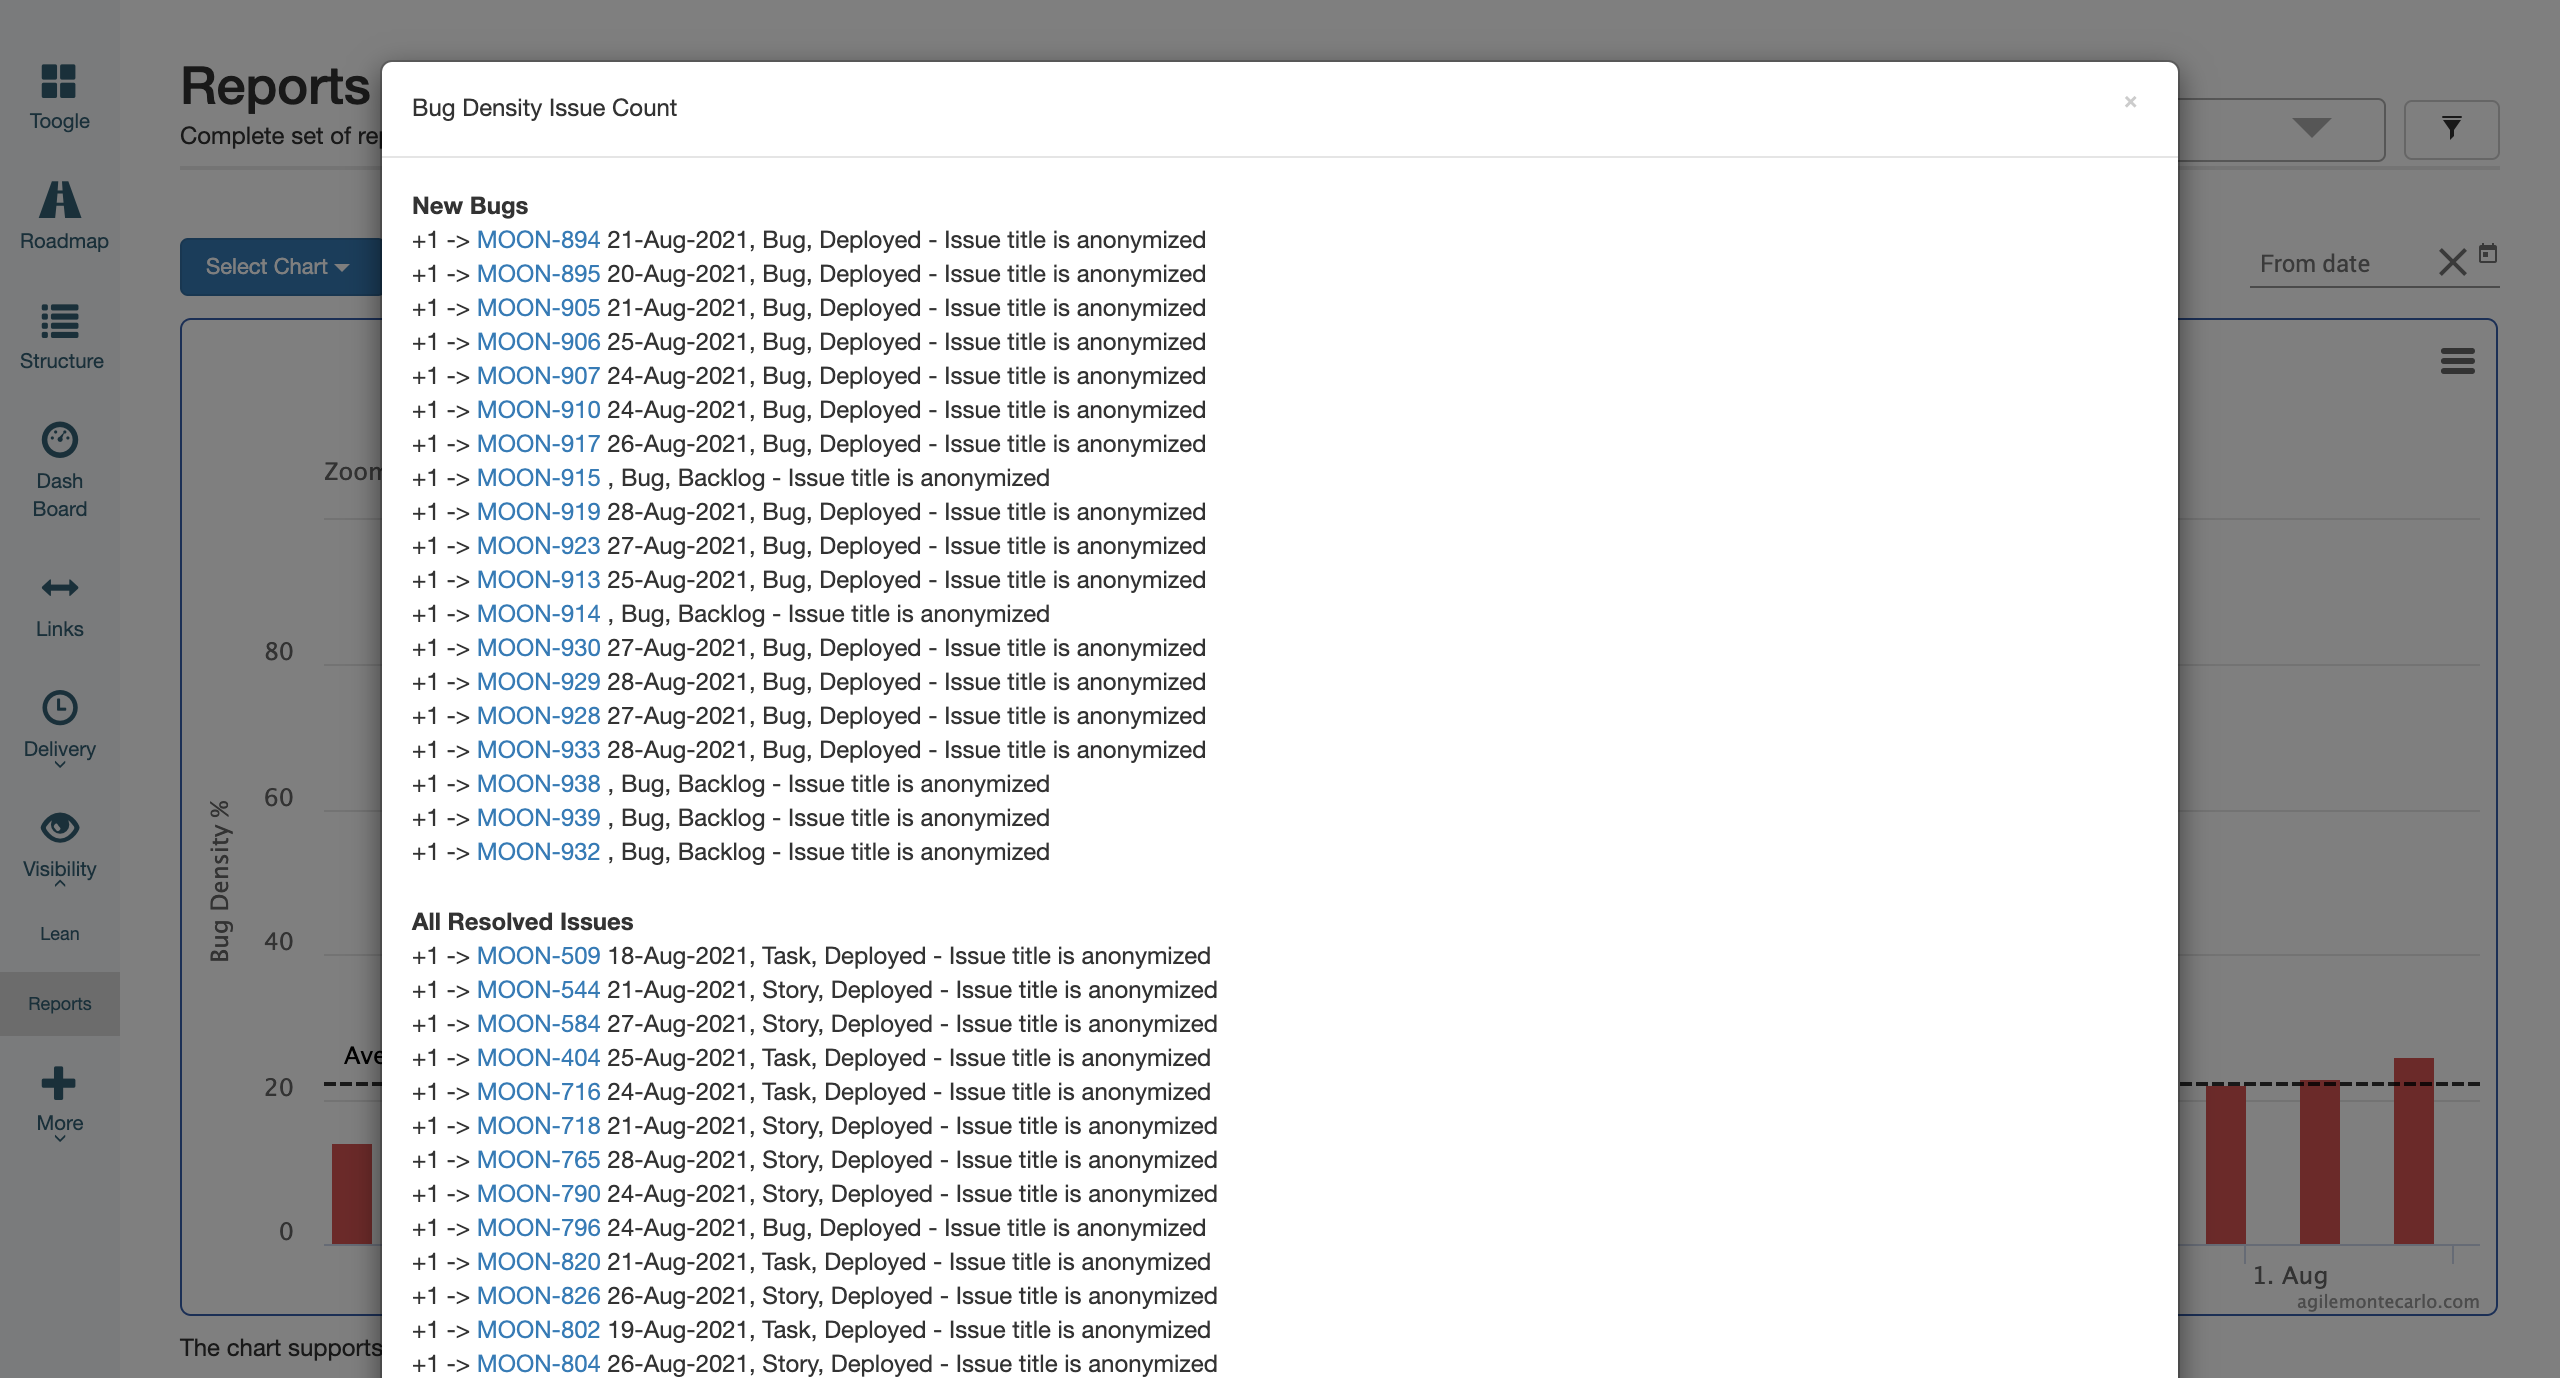
In the bug density report each bar is clickable to show detailed information on all bugs and done issues.